While many traders seek instant gratification from their trades, the gold market has only recently offered that potential to traders betting on higher prices. In fact, the last few years could be considered a mind-numbing experience for traders trying to figure out this market. The gold market finally made its move higher in the last few months and this serves as a good example of how the markets can be complicated to read, but patience can sometimes be rewarded.
I’m going to run through my analysis on how the gold market got to this point and how this process can serve as a good learning tool for traders and investors.
Let’s briefly go back to August 2011 when gold reached an all-time high above $1,900 an ounce. There was a quick selloff from the top and then a consolidation for about another year before prices trended lower for the next 4 years. The market dropped about $900 over this time. The long-term bulls wondered why and how the market could go this low. Was the stock market and economy all better at this point or was all the free money the Fed pumped into the economy still casting an ominous cloud?
Those points can be debated all day, but I believe much of the dirt was simply swept under the rug and will probably come back to haunt us someday. The important point is that the long-term gold bulls certainly weren’t rewarded for a period of at least 4 years, even though they may eventually be proven right.

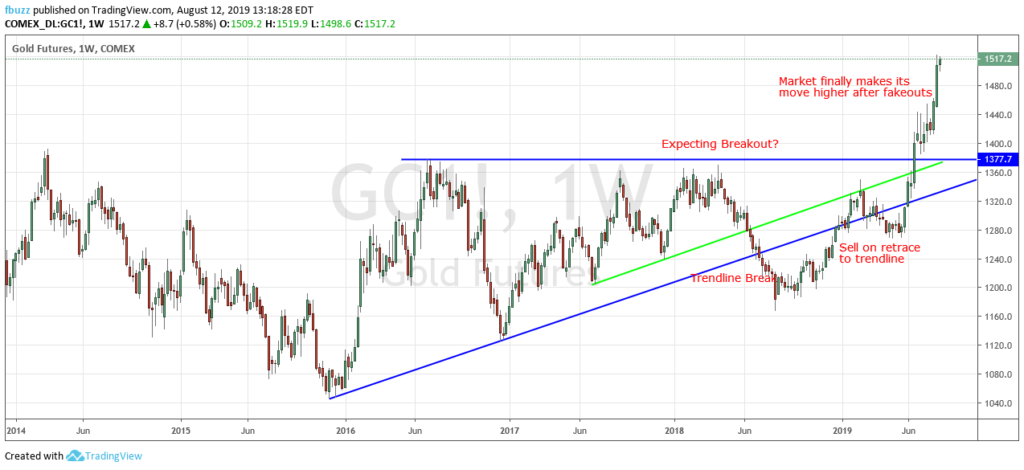
So when we look at the weekly chart on gold, the market made its bottom in November 2015 around $1,045 an ounce. From that point, it then formed a bottom / consolidation for several years. Actually, it mainly traded in a relatively small range between about $1,050 and $1,400 for nearly 7 years. So how patient do you have to be in order to trade this market from a long-term perspective? I’m sure this drove many traders and investors to focus more on short-term trading!
What I really want to discuss is the triangle consolidation pattern outlined on the chart shown above. This is easy to see with hindsight, but when you are trading in a pattern like this it can be a frustrating experience. After the pattern is clearly established, the market coils up near the resistance level in early 2018. This can often be the precursor to a major breakout to the upside. In my experience, the smart move is to wait for the breakout and then buy on a retracement near the original resistance level. No doubt, some traders couldn’t wait for the breakout and bought in anticipation that the market would move higher anyway. Well, that didn’t happen!
Gold turned south and broke trendline support. The trendline could have been a good place to buy the market, but that didn’t hold for long and those traders had to bail, which helped drive the market even lower. After a move like this happens, it usually isn’t a bad idea to short the market on a retracement back to the trendline. That trade didn’t work either.
The move to the downside was just a fakeout by the market. Usually, if a market makes a false break to the downside like this and then a strong rally back to the resistance level, it will probably have a strong breakout rally to the upside. That is exactly what happened.
Those who bought somewhere near the lower end of this range between 2016 and 2019, and held on, certainly exercised a great deal of patience. If there was ever a commodity market where traders and investors have strong conviction in prices going higher, it would be gold. This is a market where the fundamental picture seems to make sense for a great deal of investors, especially those who are hedging the stock market and believe there is a great deal of financial troubles lurking around the world.
Gold Outlook Going Forward
Volatility is increasing in stocks and there are a number of issues in the US and around the world with debt, China, tariffs, weakening economies and geopolitics. I think the debt issues and the lowering of interest rates to unprecedented levels are the main factors driving gold. It seems that the US and European countries threw everything at their economies during the financial crisis of 2008 to dig them out of trouble. What happens if the economies rollover again and we are facing another situation like 2008? What tools do we have this time around to help the economy? I personally don’t think that is going to happen, but this is a concern and could at least happen on a smaller scale.

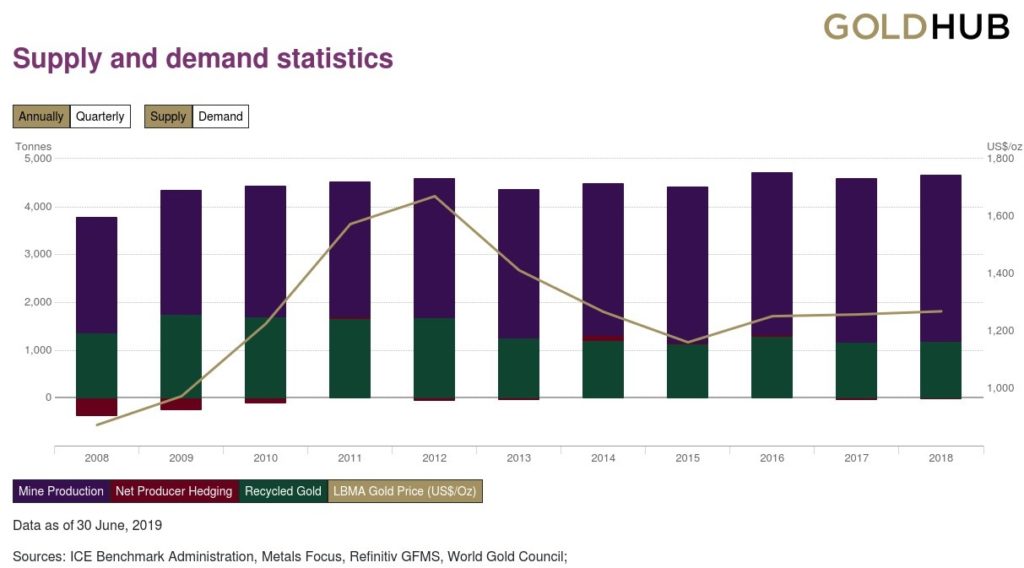
Gold isn’t getting any easier to produce. There is an old saying that gold is located in all the places where nobody wants to go. It is getting harder to find new sources and actually get to the places where it is already known to exist. Production costs are estimated to around $1,200 an ounce in general. These numbers will vary by different locations around the globe and input costs as well. The high cost of production may be a major fundamental reason why the price of gold rebounded after it went below this level in 2016.
There are a number of fundamental reasons to support higher gold prices into the future. The technical picture also looks like the market put in a long-term bottom and could go much higher. I wouldn’t be surprised to see gold challenge the all-time high in the next couple years. I wouldn’t expect it to be a straight up move, because nothing is that easy. The market like to confuse as many traders as possible, but it will eventually get to where it is going to go. The gold market is currently facing chart resistance around $1,525 – $1,550 and this could setup the market for a pullback. Those looking for a move to all-time highs will undoubtedly have to exercise patience once again and use proper risk management.


